Sample Quantitative Techniques Question for CLAT 2024
Go through the passages and the relevant data mentioned below and answer the following questions:
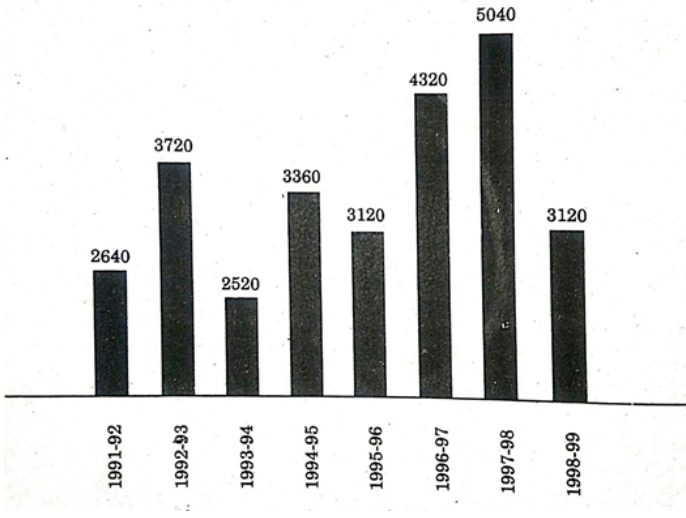
A. The above graph shows the foreign exchange reserves of a country from 1991 to 1999. Refer to it and solve the questions below:
1. The foreign exchange of 1994-95 is how many times of 1991-92?
a) 1.4
b) 1.27
c) 1.55
d) 2.3
2. What is the highest percentage increase in any year as compared to a different year?
a) 250
b) 80
c) 100
d) 50
3. In which year is the percentage increase of foreign exchange reserves the highest?
a) 1995-96
b) 1992-93
c) 1998-99
d) 1994-94
4. What is the ratio of the number of years in which foreign reserves is more than the average and the years in which it is less?
a) 5:3
b) 2:6
c) 4:4
d) 3:5
5. The foreign reserves in 1996-97 is what percent of the average foreign reserves?
a) 125
b) 120
c) 100
d) 140
1. The foreign exchange of 1994-95 is how many times of 1991-92?
a) 1.4
b) 1.27
c) 1.55
d) 2.3
2. What is the highest percentage increase in any year as compared to a different year?
a) 250
b) 80
c) 100
d) 50
3. In which year is the percentage increase of foreign exchange reserves the highest?
a) 1995-96
b) 1992-93
c) 1998-99
d) 1994-94
4. What is the ratio of the number of years in which foreign reserves is more than the average and the years in which it is less?
a) 5:3
b) 2:6
c) 4:4
d) 3:5
5. The foreign reserves in 1996-97 is what percent of the average foreign reserves?
a) 125
b) 120
c) 100
d) 140
Answers
1. b
2. c
3. b
4. d
5. a
2. c
3. b
4. d
5. a
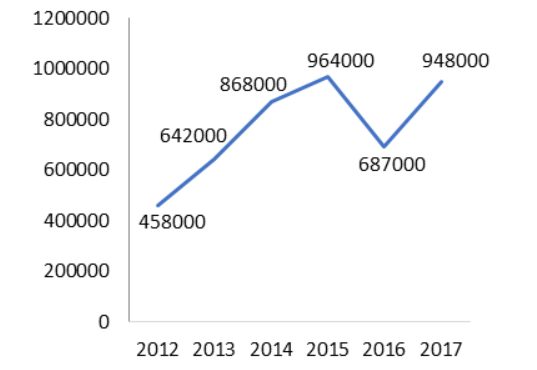
B. This graph shows the annual growth of the company ToysRWe in India, from 2012 to 2017. Use it to answer the questions below.
1. The toy sale in 2016 is how many times of toys sold in 2012?
a) 1.5
b) 2
c) 0.5
d) 2.5
2. The sale of toys in 2017 is how much more than in 2016?
a) 251000
b) 261000
c) 271000
d) 281000
3. What is the total sale of toys from 2015 to 2017?
a) 2750
b) 2500
c) 2696
d) 2599
4. If, say, in 2018, the number of toys sold is increased by 10% as compared to 2017, what will be the difference between the number of toys sold in 2018 and 2015?
a) 78800
b) 82000
c) 84200
d) 79800
5. The percentage of toys sold was highest in which year as compared to previous years?
a) 2015
b) 2014
c) 2013
d) 2012
Answers
1. a
2. b
3. d
4. a
5. d
2. b
3. d
4. a
5. d
Preparing for CLAT? Prepare with CLATalogue
Subscribe for updates
Join 10,000+ subscribers.
SA
Sanya Ambastha
Contributing author
Have a doubt about this?Ask Doubts