
Sample Questions for CLAT 2024: Quantitative Techniques
SAMPLE QUESTIONS
A. The total number of students that passed Sophia Academy is one-fourth of the total number of passed students. The total number of students that passed YS College is 800, which is one-fifth of the total number of passed students. The ratio of the total number of students that passed from colleges A and B is 6: 5 respectively.
The total number of boys and girls that passed from Tiger College was 480 and 400 respectively. The ratio of boys and girls that passed from Sophia Academy is 7 : 3 respectively. The number of girls that passed college B is 100 more than the number of boys that passed from the same college. The number of girls that passed from college A was 100 less than the number of girls that passed from Sophia Academy. The total number of boys that passed from all the colleges was 2310.
Q.1 What is the percentage of the total number of girls who passed from all colleges taken together?
a) 42.25%
b) 46%
c) 41.5%
d) 45%
Q.2 What is the difference between the number of girls who passed from Q and S?
a) 60
b) 40
c) 50
d) 55
Q.3 What is the average number of students that passed from colleges YS College, B, Sophia Academy?
a) 680
b) 800
c) 700
d) 750
Q.4 In which college is the percentage of boys that passed with respect to the total number of students of the college who passed the maximum?
a) A
b) B
c) Sophia Academy
d) Tiger College
The total number of boys and girls that passed from Tiger College was 480 and 400 respectively. The ratio of boys and girls that passed from Sophia Academy is 7 : 3 respectively. The number of girls that passed college B is 100 more than the number of boys that passed from the same college. The number of girls that passed from college A was 100 less than the number of girls that passed from Sophia Academy. The total number of boys that passed from all the colleges was 2310.
Q.1 What is the percentage of the total number of girls who passed from all colleges taken together?
a) 42.25%
b) 46%
c) 41.5%
d) 45%
Q.2 What is the difference between the number of girls who passed from Q and S?
a) 60
b) 40
c) 50
d) 55
Q.3 What is the average number of students that passed from colleges YS College, B, Sophia Academy?
a) 680
b) 800
c) 700
d) 750
Q.4 In which college is the percentage of boys that passed with respect to the total number of students of the college who passed the maximum?
a) A
b) B
c) Sophia Academy
d) Tiger College
Q.5 The number of boys that passed from Sophia Academy is what percentage more or less than the girls who passed from the same college?
a) 47.5%
b) 56.2%
c) 65.4%
d) 57.1%
Answers
1. a
2. c
3. b
4. a
5. d
B. The following table gives the growth rates in GDP (%) for 10 economies of the world over the period 2004 to 2008. Use it to answer the following questions:
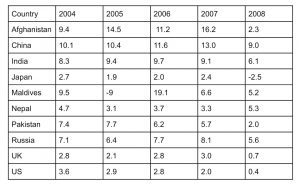
Q.1 Among the following countries, which country’s GDP grew at the greatest rate over the period 2005 to 2008?
a) India
b) Maldives
c) Russian Federation
d) Afghanistan
b) Maldives
c) Russian Federation
d) Afghanistan
Q.2 What was the ratio of India’s GDP in the year 2005 to that in the year 2003?
a) 11:10
b)13:11
c) 12:11
d) Cannot be determined
b)13:11
c) 12:11
d) Cannot be determined
Q.3 By what percentage did Pakistan’s GDP increase over the period 2006–2008?
a) 14.5%
b) 11.4%
c) 9.3%
d) 7.8%
b) 11.4%
c) 9.3%
d) 7.8%
Q.4 Among the countries for which the above data is given, which country had the highest GDP in the year 2007?
a) Afghanistan
b) China
c) India
d) Cannot be determined
b) China
c) India
d) Cannot be determined
Q.5 For how many countries, among those given, was the GDP in 2005 lower than the GDP in the year 2003?
a) 6
b) 1
c) 0
d) Cannot be determined
b) 1
c) 0
d) Cannot be determined
Answers
- b
- b
- d
- d
- b
Subscribe for updates
Join 10,000+ subscribers.
SA
Sanya Ambastha
Contributing author
Have a doubt about this?Ask Doubts